Grafana
The open-source platform for monitoring and observability
Screenshots
About
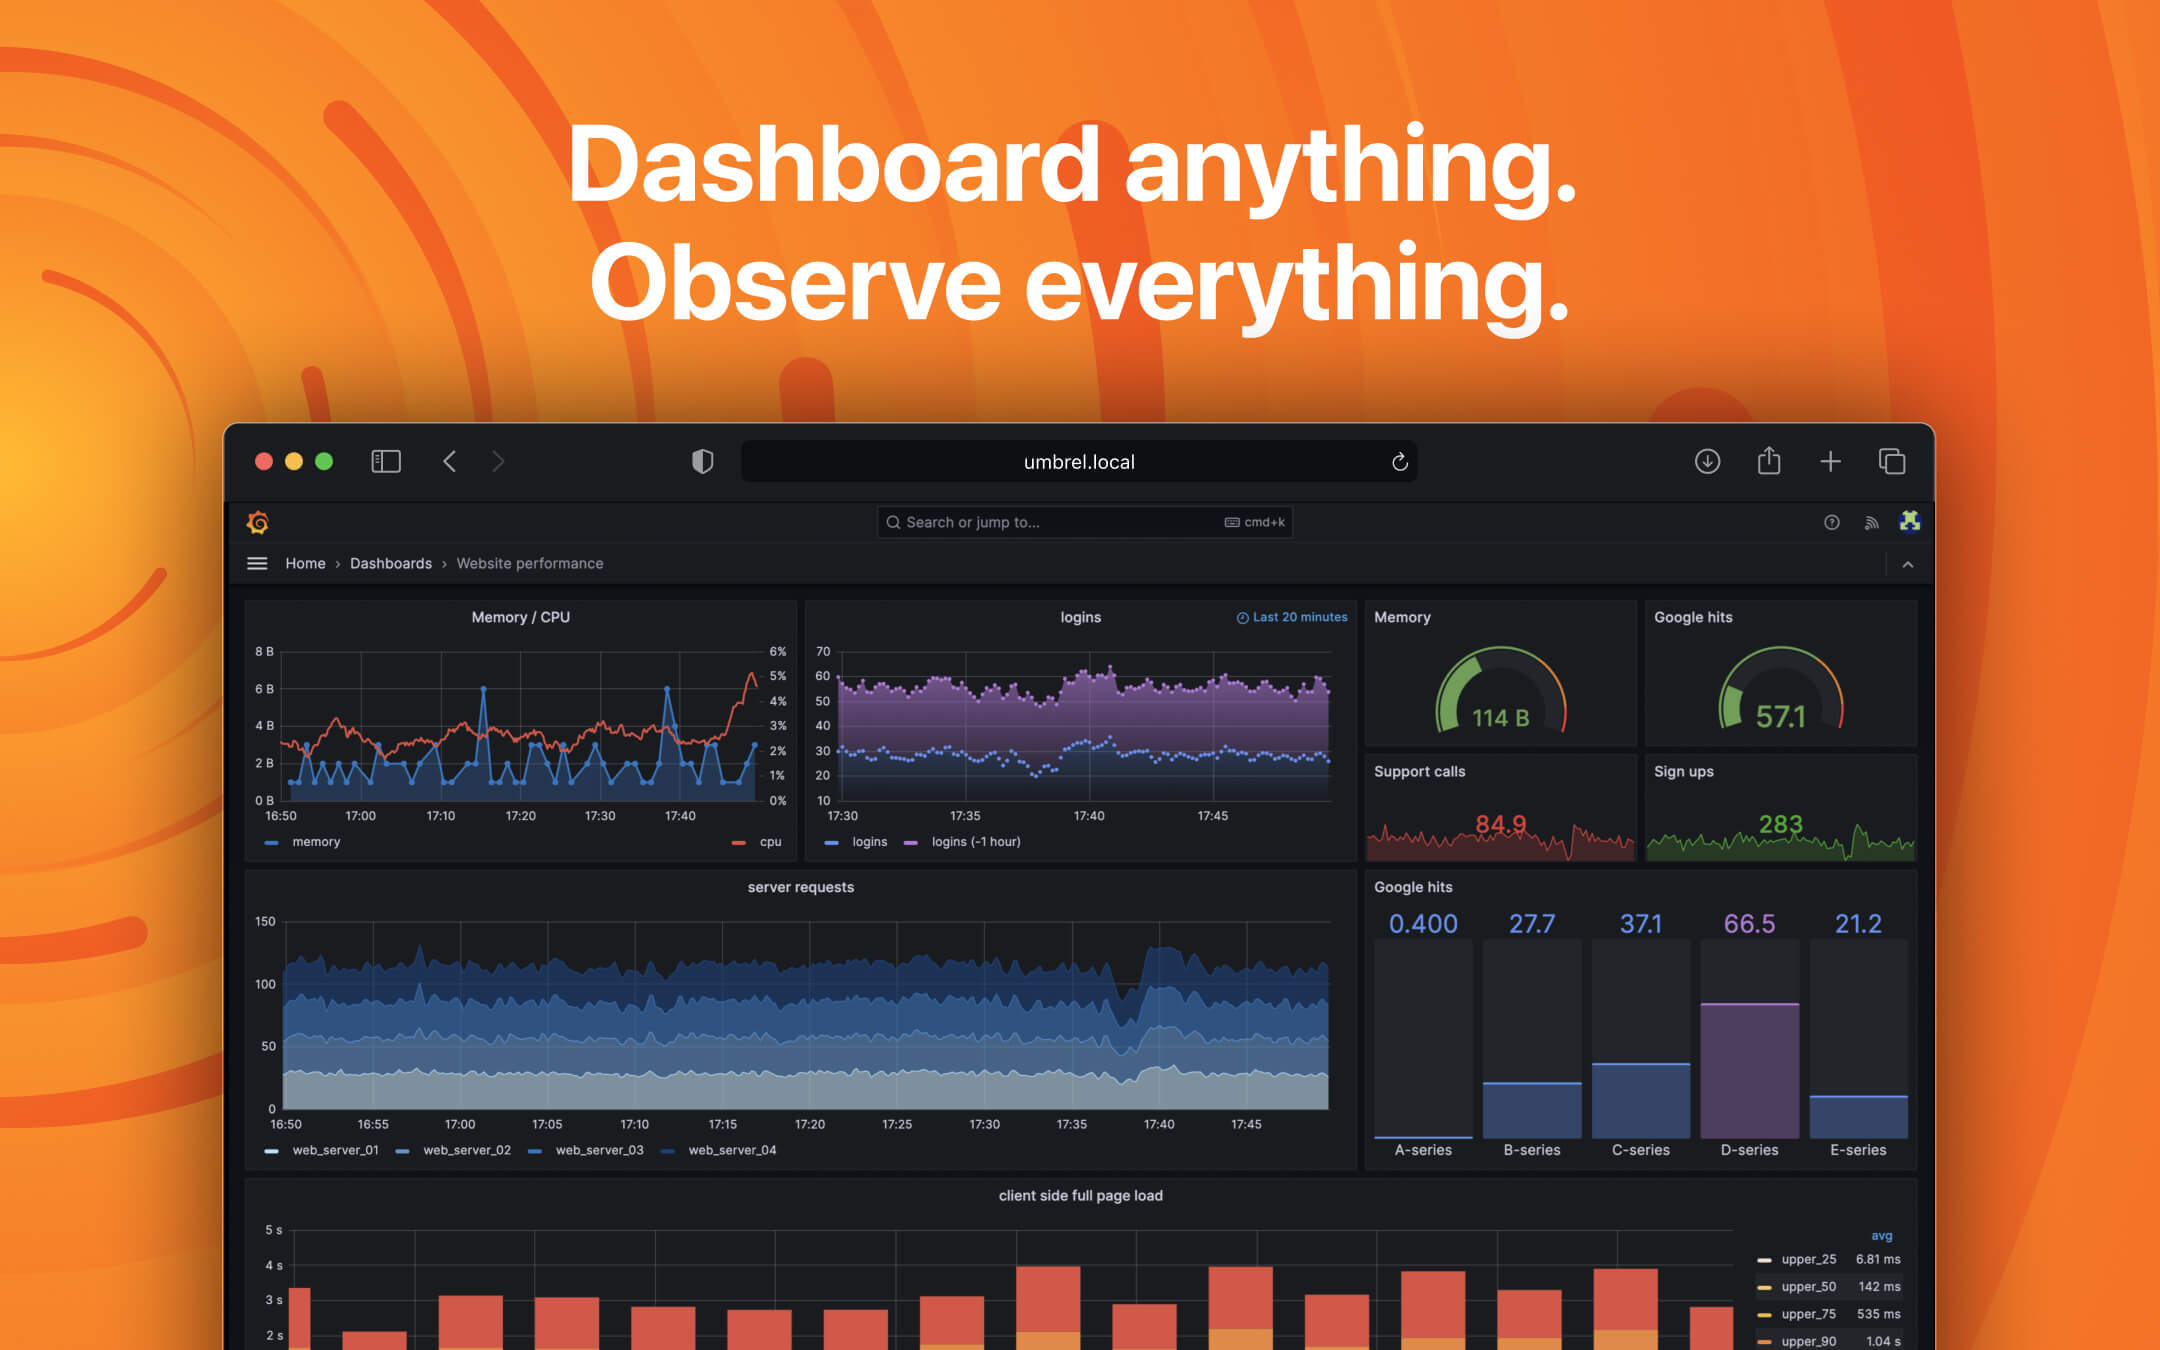
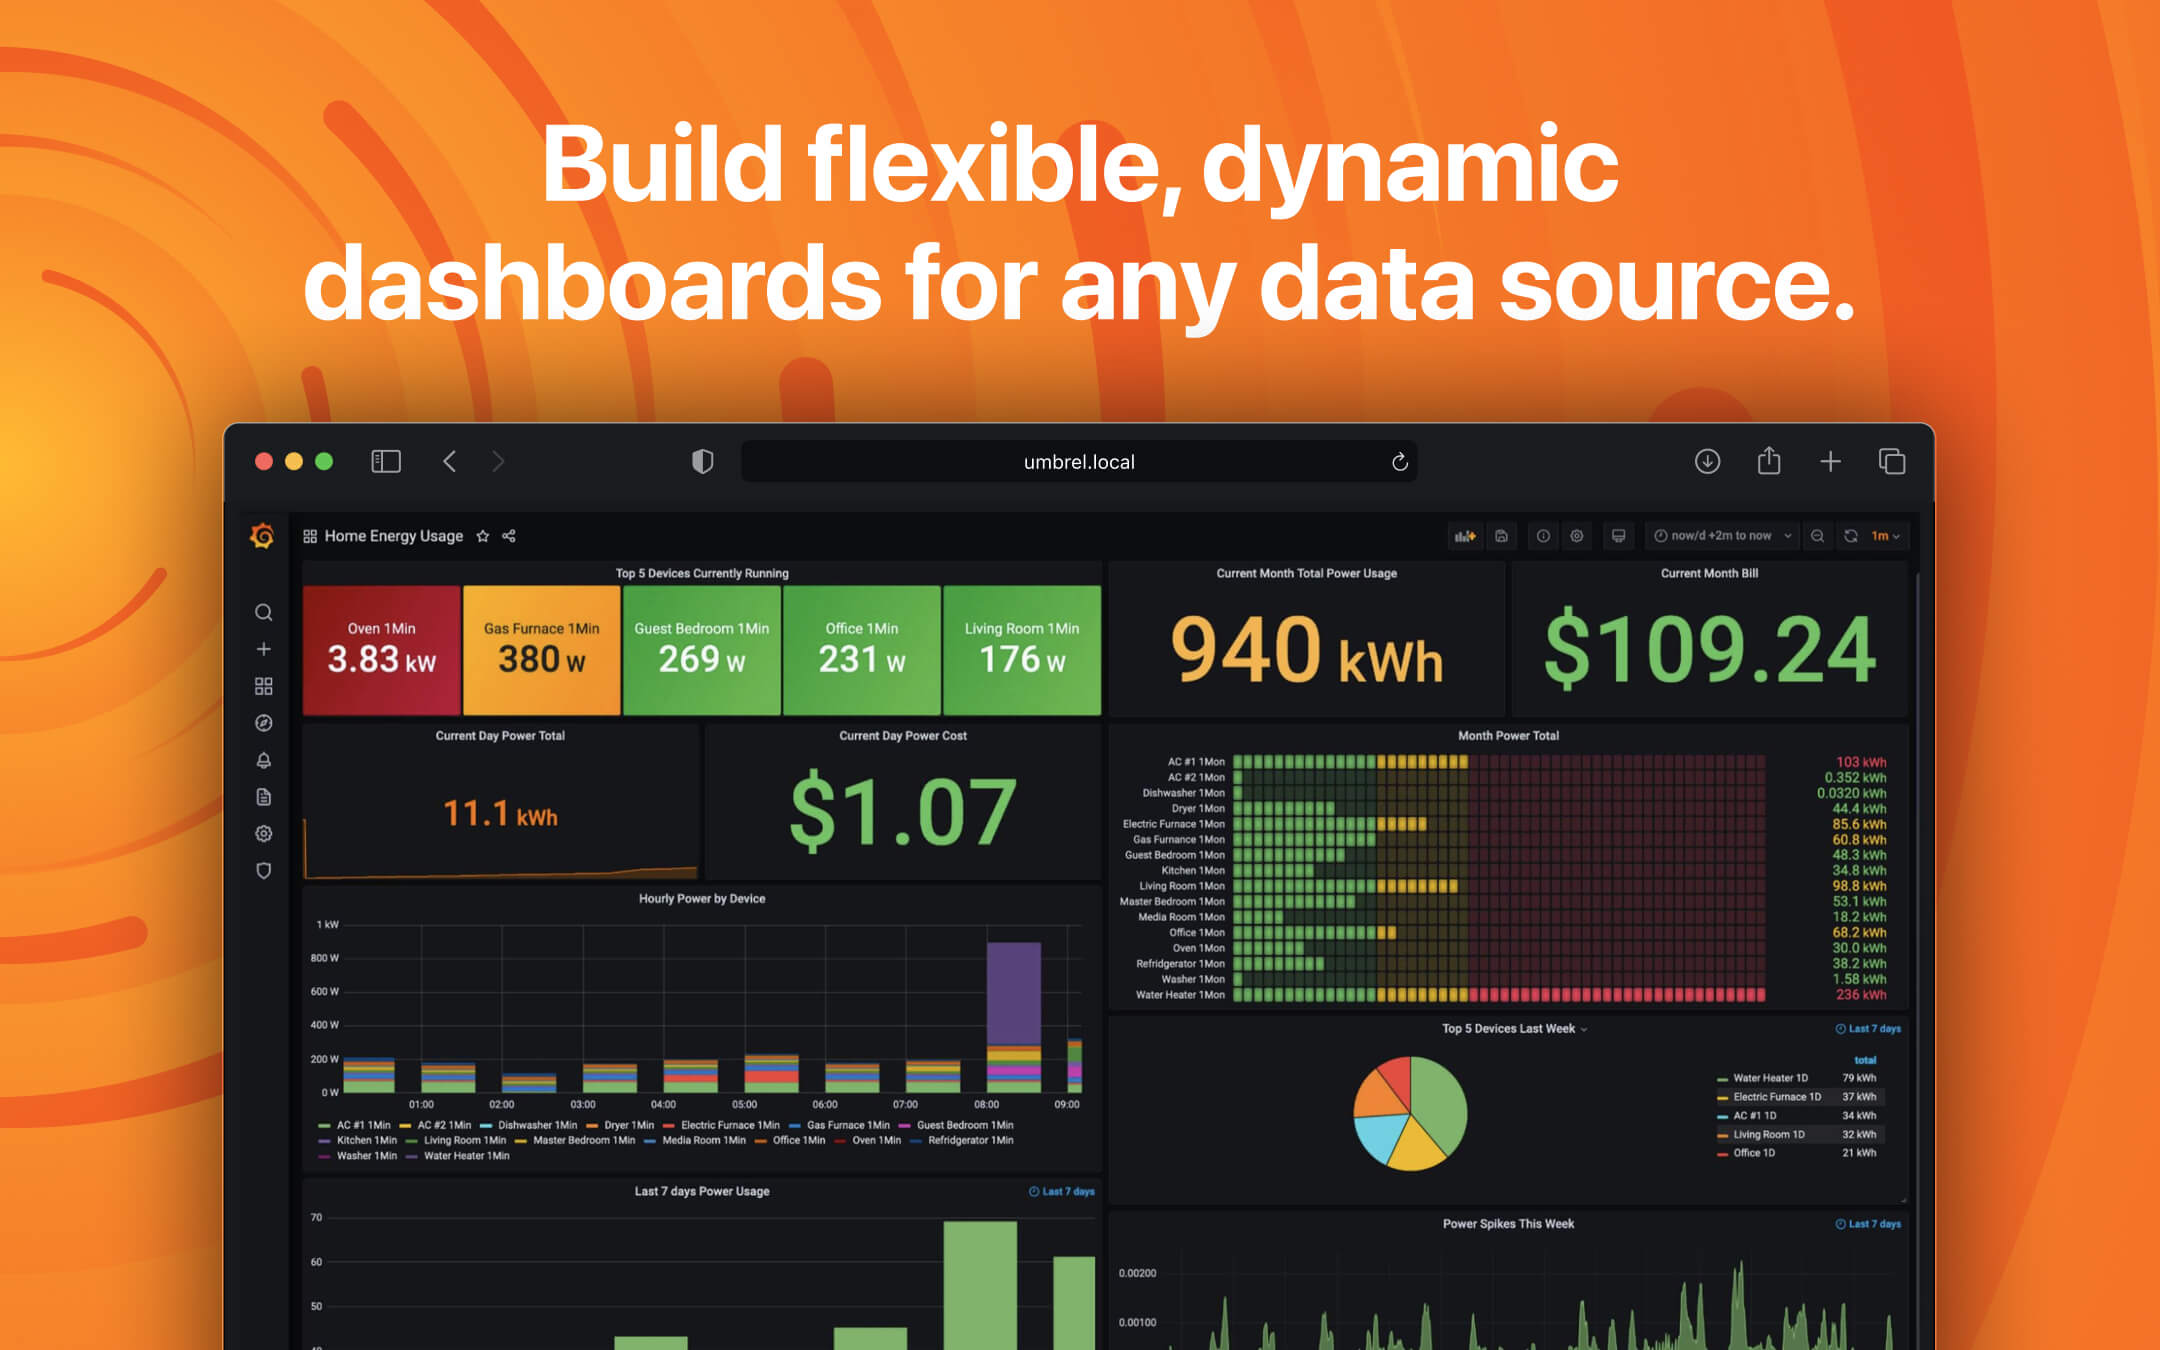
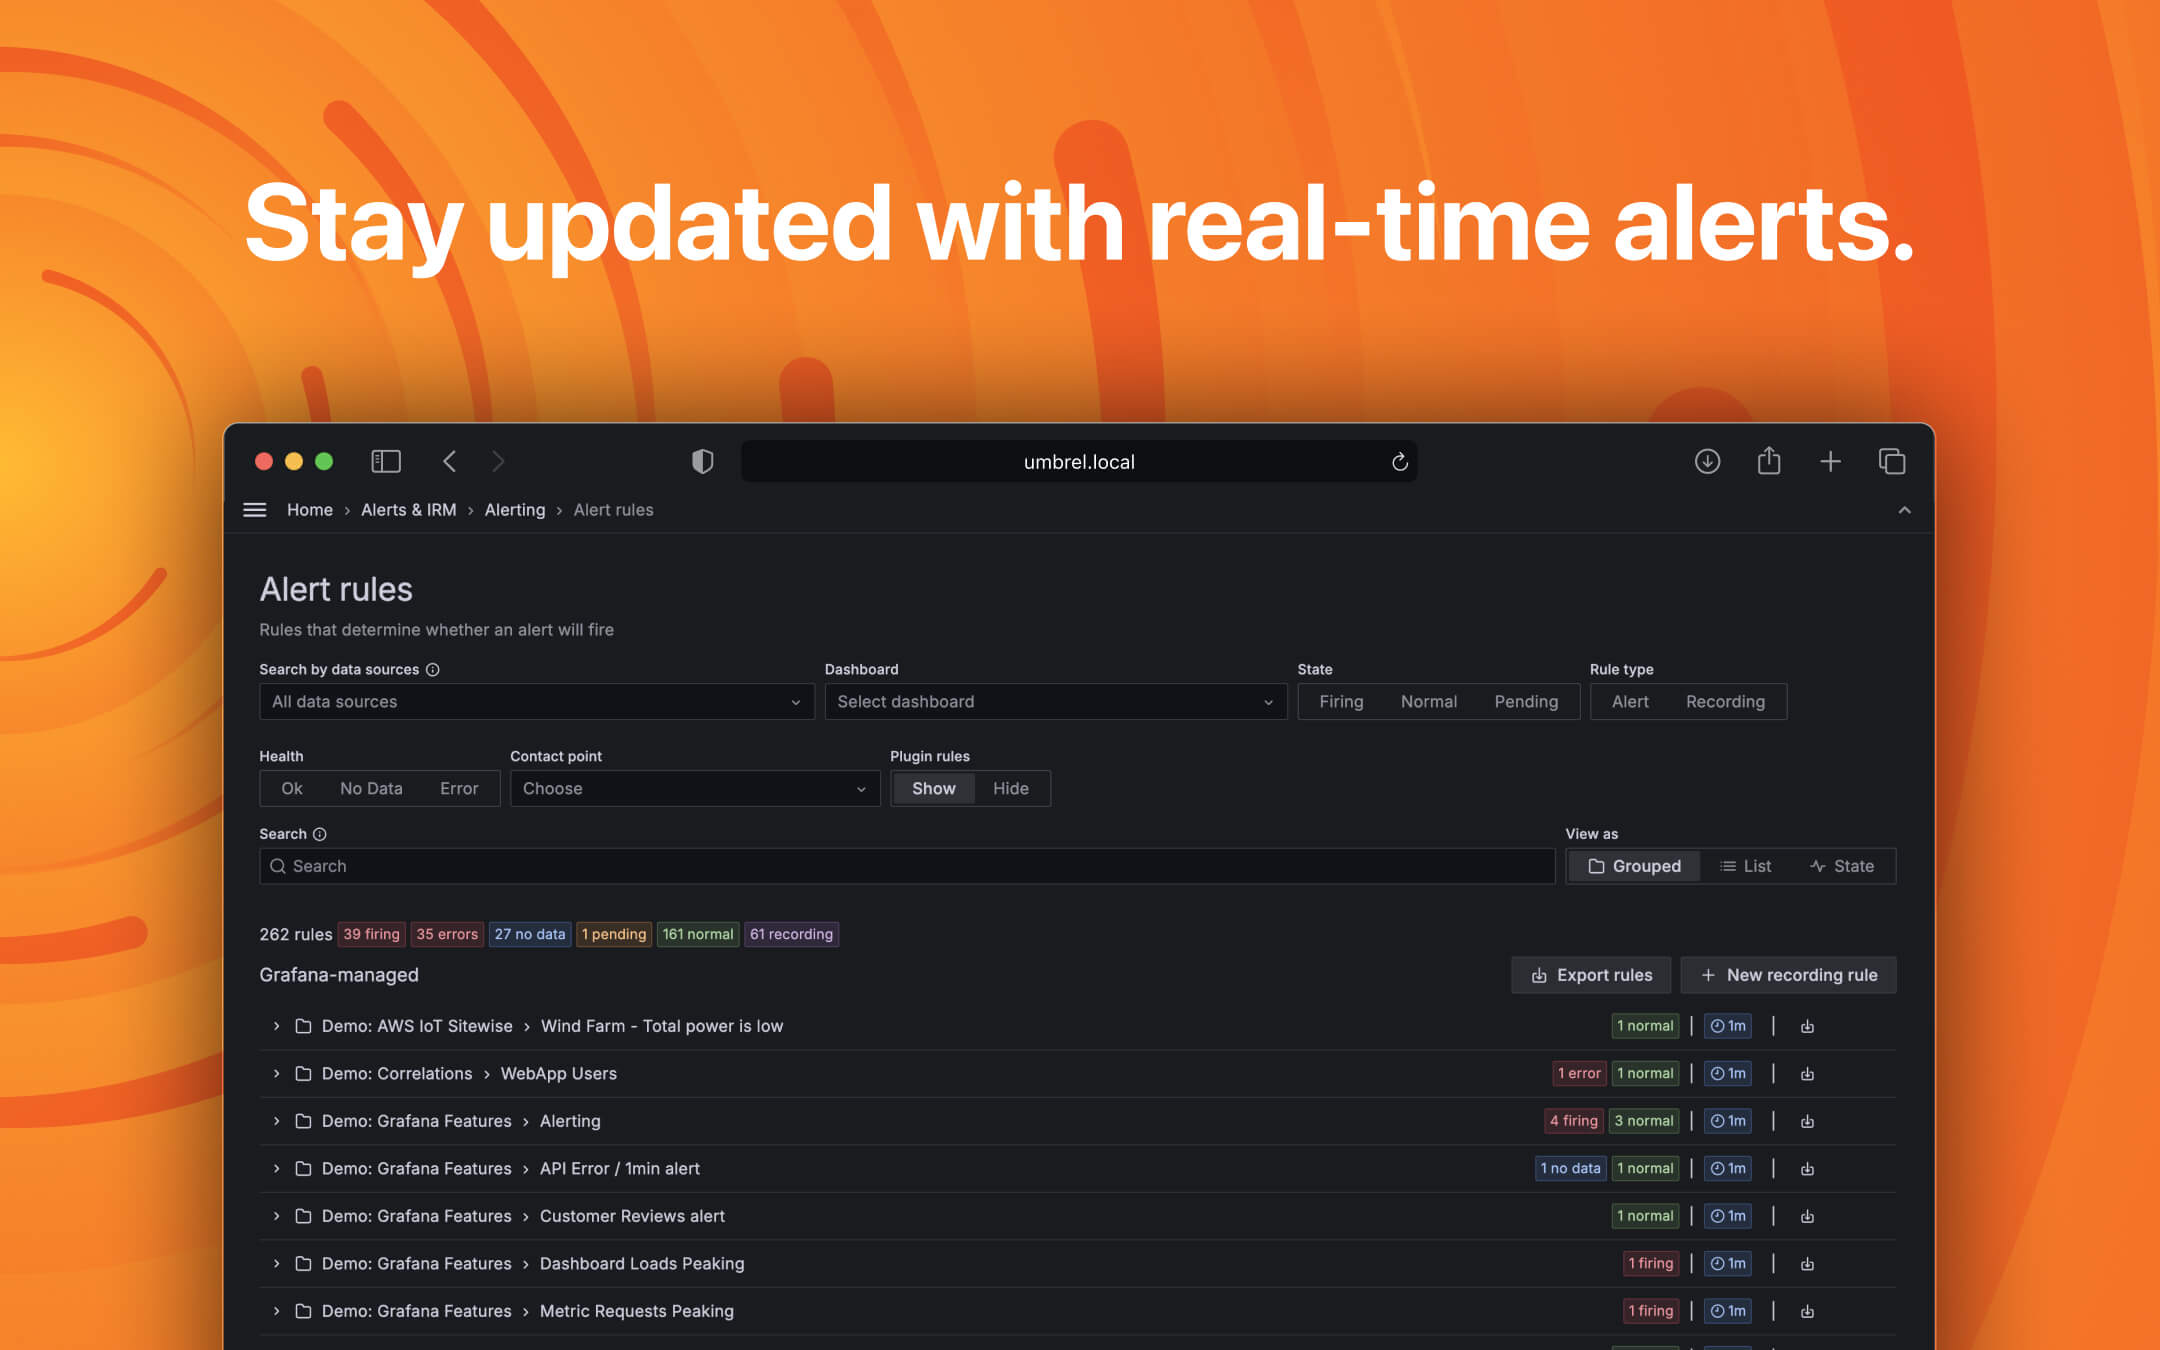
Grafana allows you to query, visualize, alert on and understand your metrics no matter where they are stored. Create, explore, and share dashboards with your team and foster a data-driven culture: - Visualizations: Fast and flexible client side graphs with a multitude of options. Panel plugins offer many different ways to visualize metrics and logs. - Dynamic Dashboards: Create dynamic & reusable dashboards with template variables that appear as dropdowns at the top of the dashboard. - Explore Metrics: Explore your data through ad-hoc queries and dynamic drilldown. Split view and compare different time ranges, queries and data sources side by side. - Explore Logs: Experience the magic of switching from metrics to logs with preserved label filters. Quickly search through all your logs or streaming them live. - Alerting: Visually define alert rules for your most important metrics. Grafana will continuously evaluate and send notifications to systems like Slack, PagerDuty, VictorOps, OpsGenie. - Mixed Data Sources: Mix different data sources in the same graph! You can specify a data source on a per-query basis. This works for even custom datasources.
Release Notes
This release includes new features and improvements: - Added new "Switch" variable type for dashboards - Improved alerting with better error messages and position-based matching - Enhanced CloudWatch Logs with support for Log Anomalies query type - Added fields selector component for Logs visualization - Improved Table component with better formatting options for Pill and JSON cells - Added MapLibre style base layer for Geomap - Enhanced time comparison features with automatic show/hide menu - Improved folder picker with parent folder display when searching - Added support for custom time units on x-axis in TimeSeries - Fixed annotation loading issues in repeated rows - Fixed dashboard permissions for anonymous users with editor permissions - Fixed folder moving to root folder - Fixed starred state not being updated properly - Fixed various alerting issues including contact point settings and notification policies Full release notes are available at https://github.com/grafana/grafana/releases